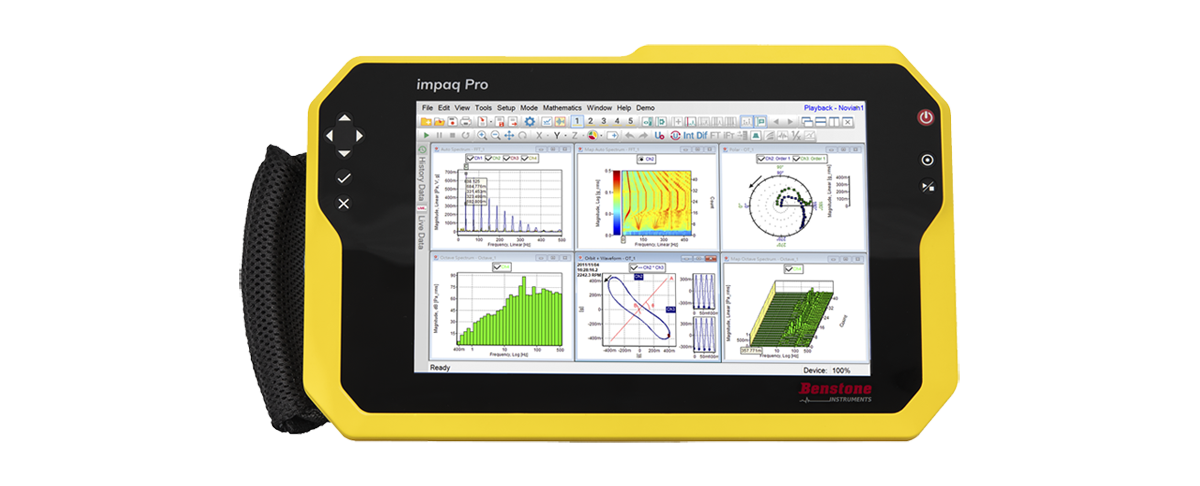
impaq Pro is a new portable vibration analyzers from Benstone Instruments.
Multiple FFT spectrum analysis, order tracking analysis and octave spectrum analysis can be measured at the same time with Windows 10's multi-tasking feature.
Equipped with a large 10.1” multi-touch color display, the impaq Pro Portable Vibration Analyzer presents information in an intuitive user interface with keypads on both sides.
The handheld vibration analyzer's internal Li-Po battery provides up to 6-hours of continuous operation, which can be extended with an external 5V battery bank.
The rugged housing is made of ABS plastic and is IP65-rated.
At only 1.4 kg, the impaq Pro Portable Vibration Analyzer is noticeably light and compact.
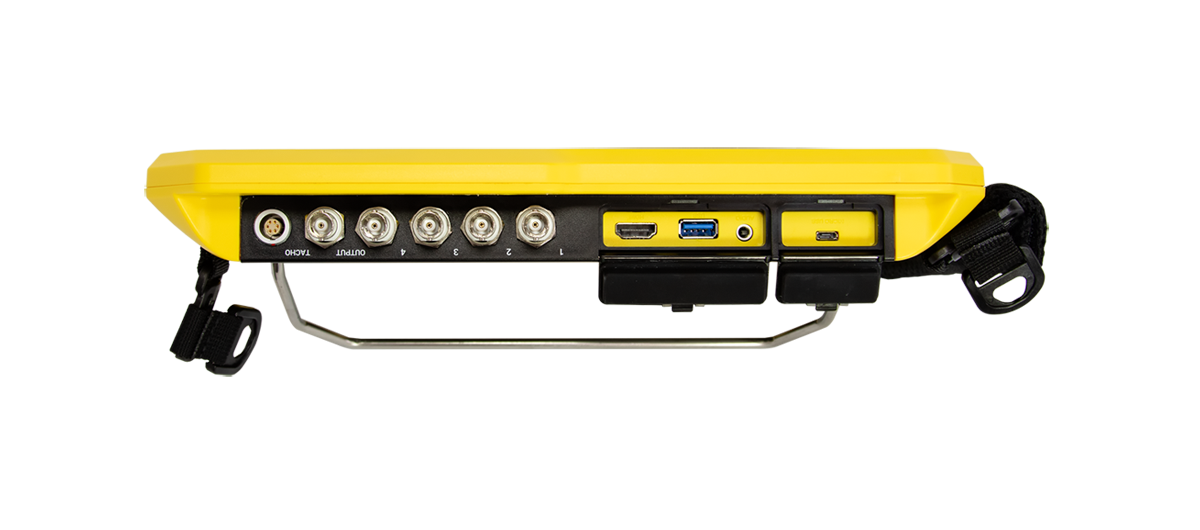
impaq Pro Portable Vibration Analyzer's input/output channels and interface:
● Analog input channel X4, BNC connectors
● Analog output channel X1, BNC connector
● Tacho input channel X1, LEMO 6-pin connector (with built-in power supply)
● Power supply: 5V, mini USB port X1
● Display: HDMI port X1
● USB port: USB 3.0 X1
● Built-in wifi and Bluetooth
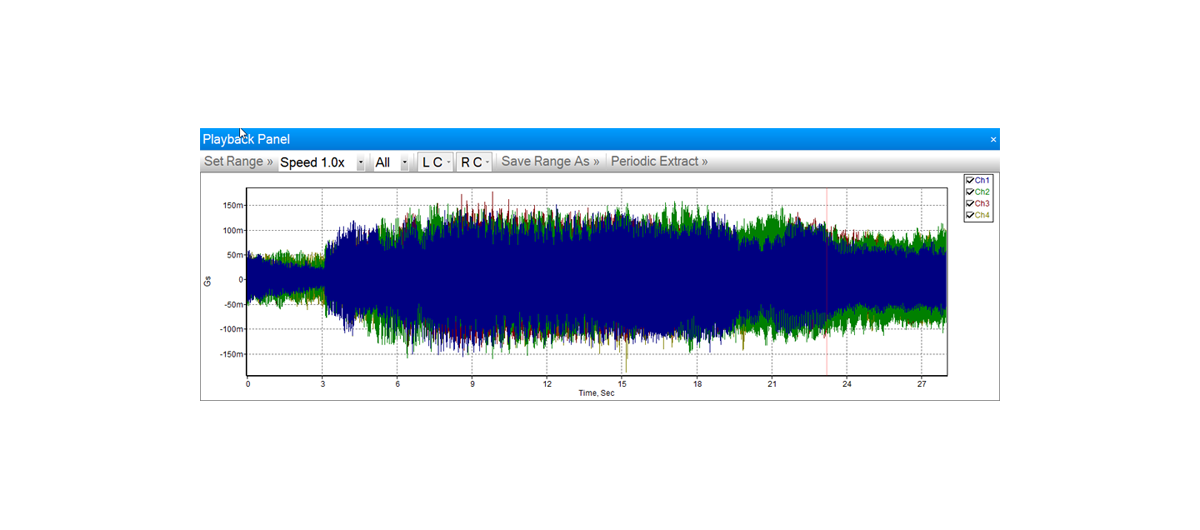
Raw Data Recorder (optional)
● Measure analog signals and store the raw data signal directly to the hard drive or memory at the same time.
● Replay the stored raw signal in the playback mode to apply user defined parameters, such as certain time periods for further analysis.
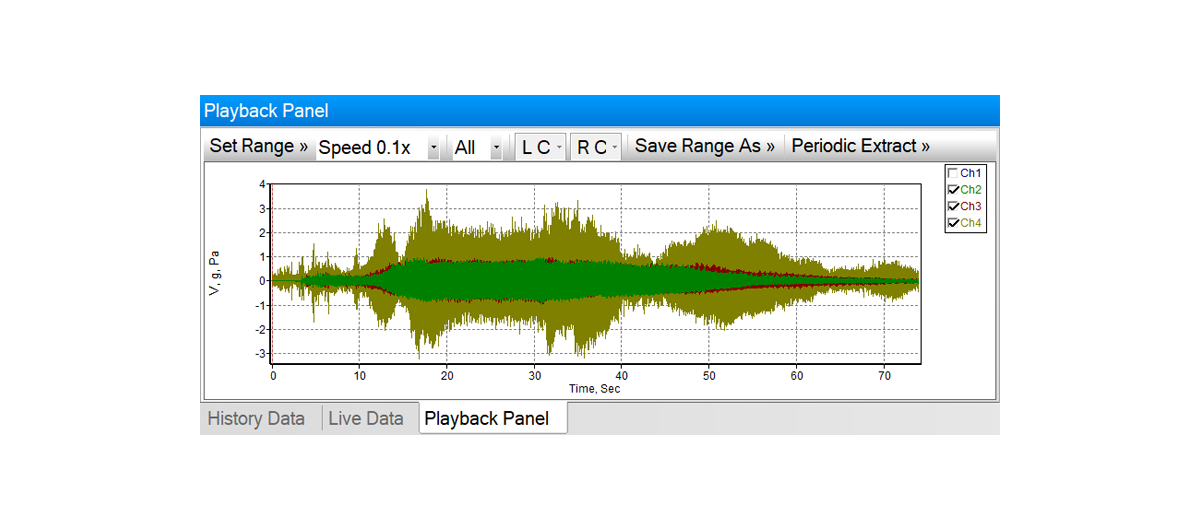
Playback Mode
Replay a previously saved raw signal file for post-process vibration
FFT, octave, or order tracking analysis
Reset vibration analysis parameters such as frequency band, resolution lines, average, triggering etc, can be set differently.
Automatic resampling if the frequency band of analysis is lower than that of data recording, with the optional FFT Spectrum Analysis Module.
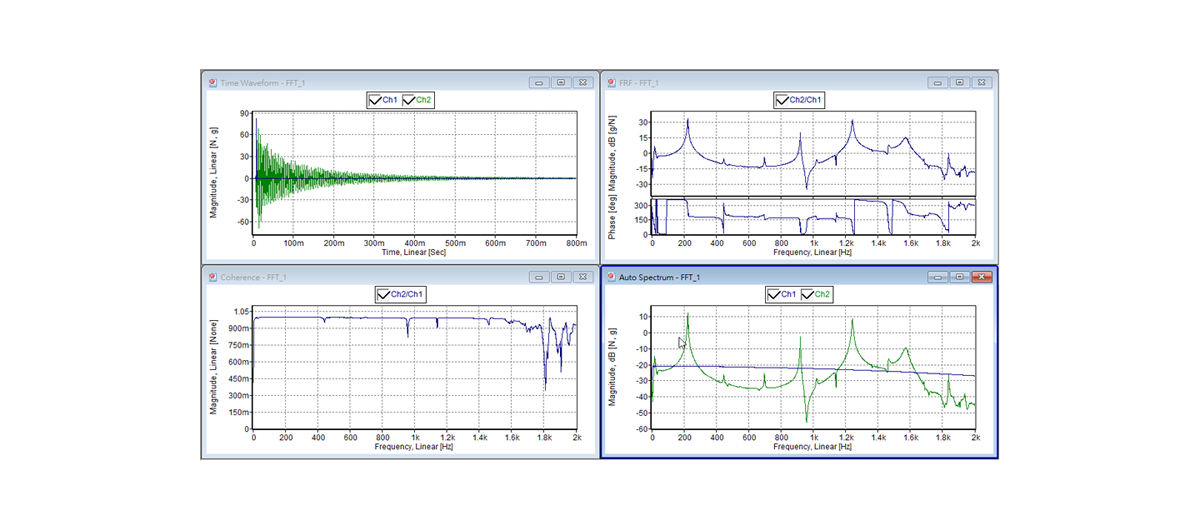
FFT Spectrum Analysis Module (optional)
14 different measurement functions
Define alarm, severity levels, apply bands, display Go/ NG on plots and more
Continuous start-up/ coast-down spectrum and display on a 3D waterfall/ intensity plot
Perform modal, ODS, enveloping and more.
● General sound & vibration analysis
● Modal testing and ODS measurement
● Sound intensity measurement
● Sound and vibration quality measurement
● Stiffness measurement
● Bearing diagnosis
● Variable speed machine measurement
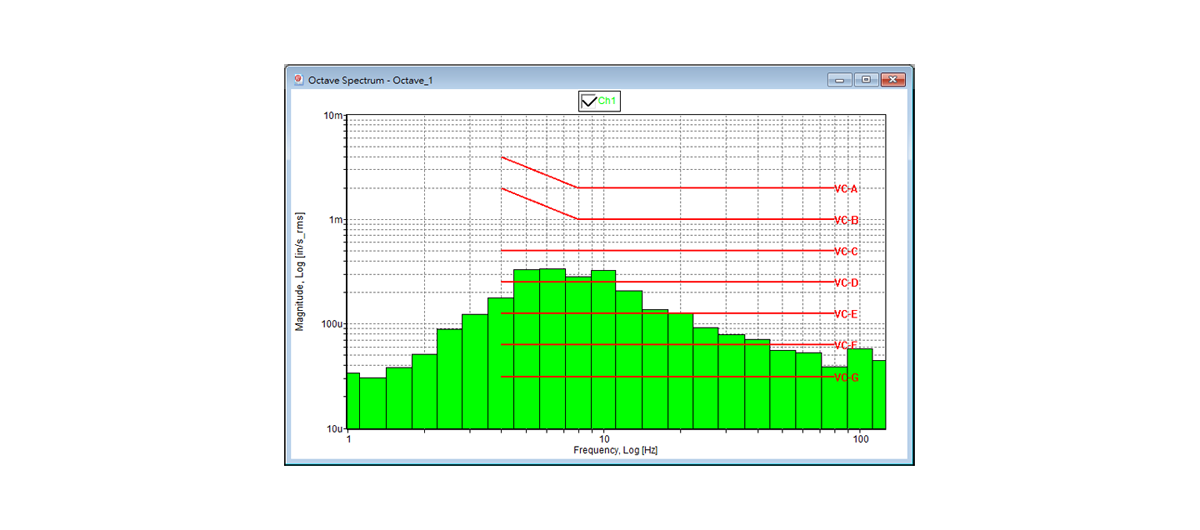
Octave Spectrum Analysis Module (optional)
● Generate octave, 1/3 octave or 1/12 octave spectrum.
● Evaluate the sound or vibration severity
● Built-in, user-defined weighting functions supports specific measurements
● User-defined VC curves display on the octave spectrum plot
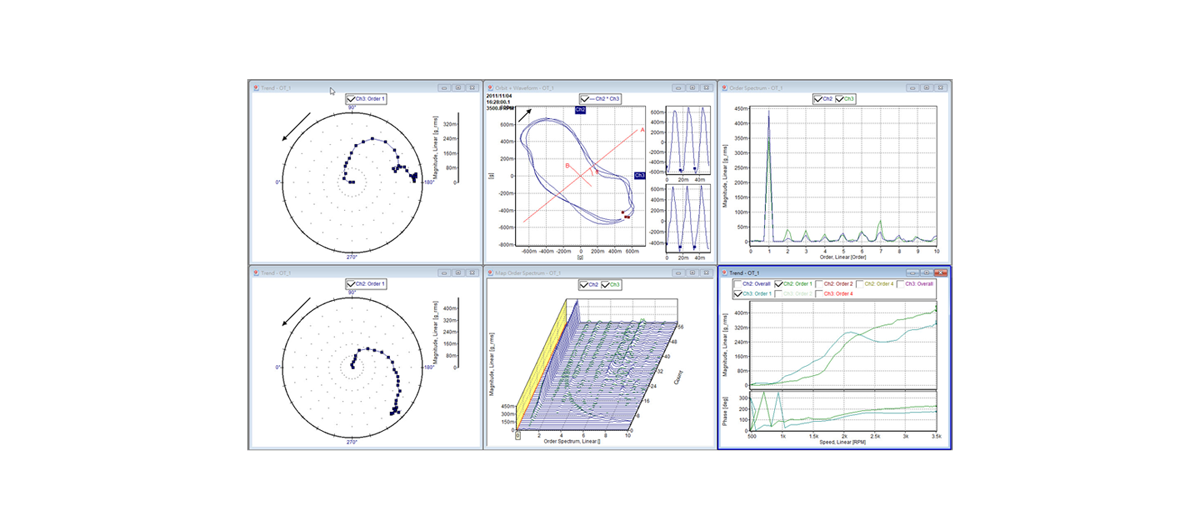
Computed Order Tracking Module (optional)
● Measure sound and vibration on varying speed machines.
● Digital re-sampling algorithm to make spectral resolutions the same at different rotation speeds.
● NVH (Noise, Vibration, Harshness) testing of vehicles
● Advanced vibration analysis of turbine machines.