Products

Turbomachinery Vibration Analysis system

TurboStar Turbomachinery Vibration Analyzer

<-- This is new lazy loading method-->
turbomachinery vibration analysis for predictive maintenance
Turbomachinery Vibration Analyzer Powered by SQL database
Turbomachinery vibration analysis user interface
turbomachinery vibration analysis with bode plot, polar plot, orbit, filtered orbit and shaft centerline displays
Field-Proven Accuracy for predictive maintenance

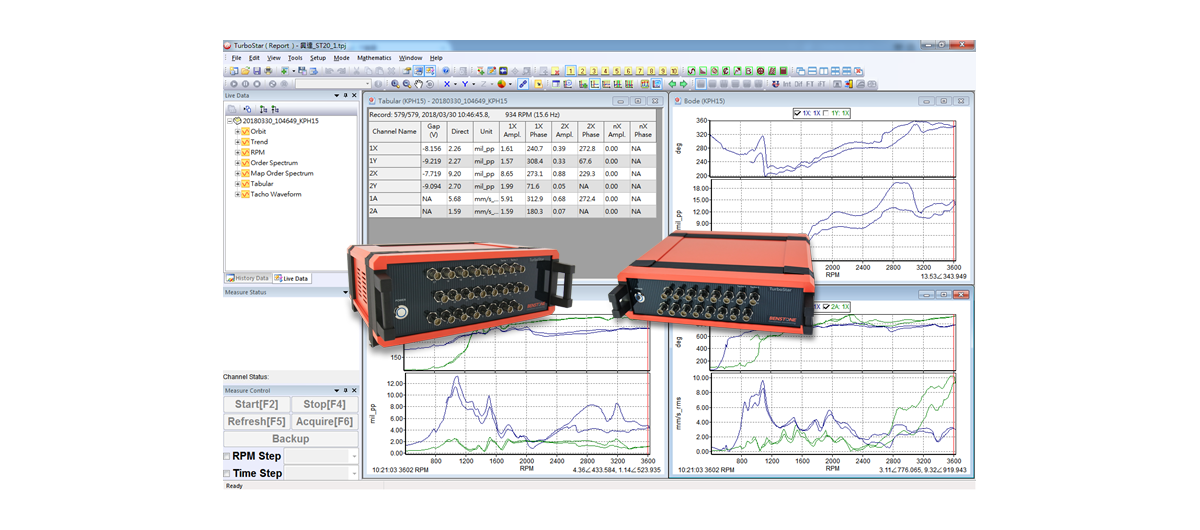
Monitor Turbomachinery Health with TurboStar Vibration Analyzer 
Choose either 14-, 22- or 30-channel systems

Powered by SQL Database
Each measured data is automatically saved to the database once measured
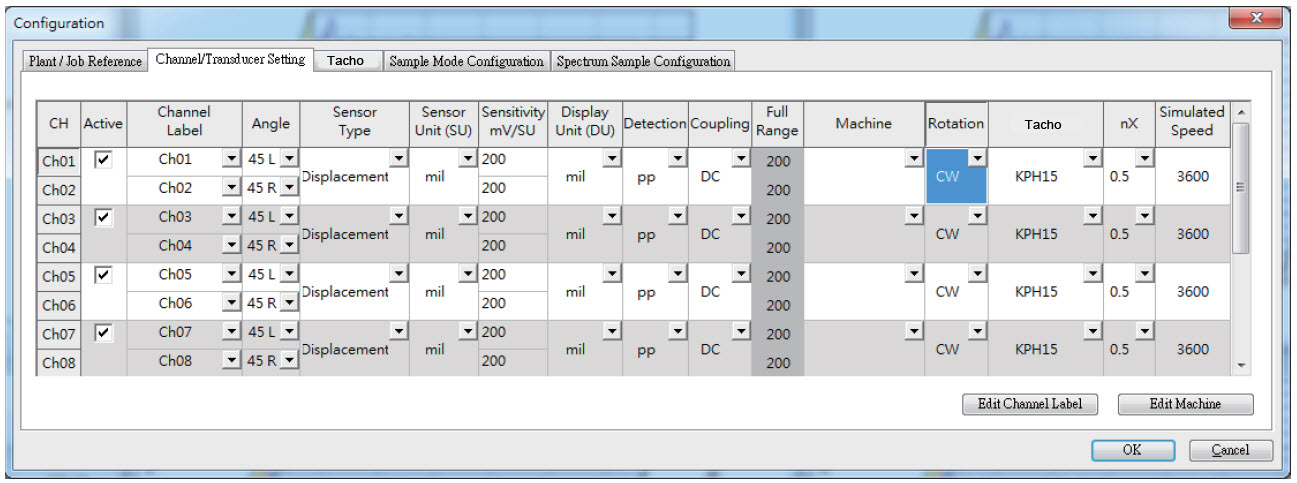
Classic user interface is simple yet powerful
Complicated measurement setups are easy and fast
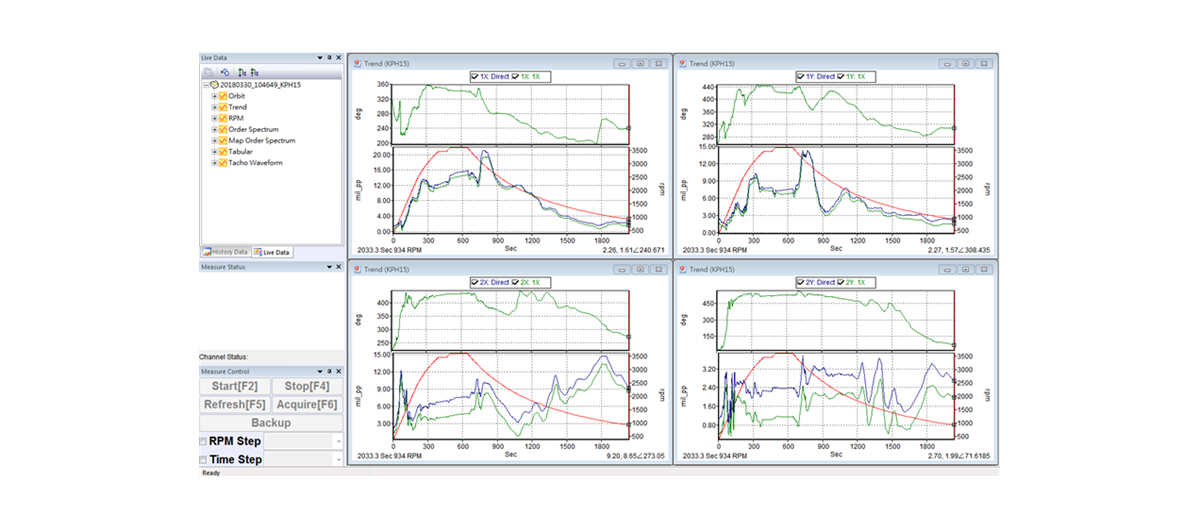
Powerful Predictive Maintenance Software Functions
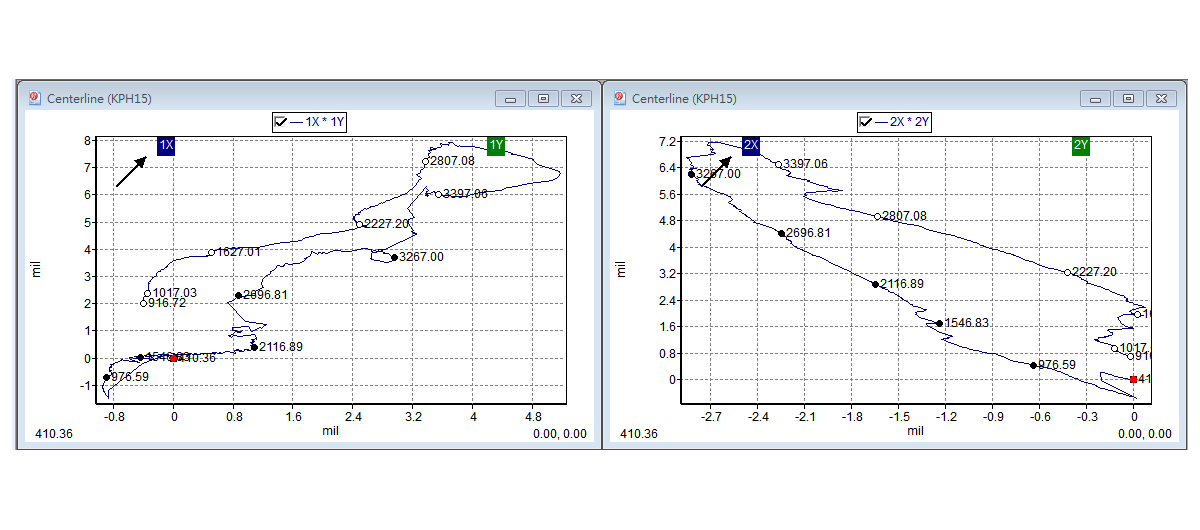
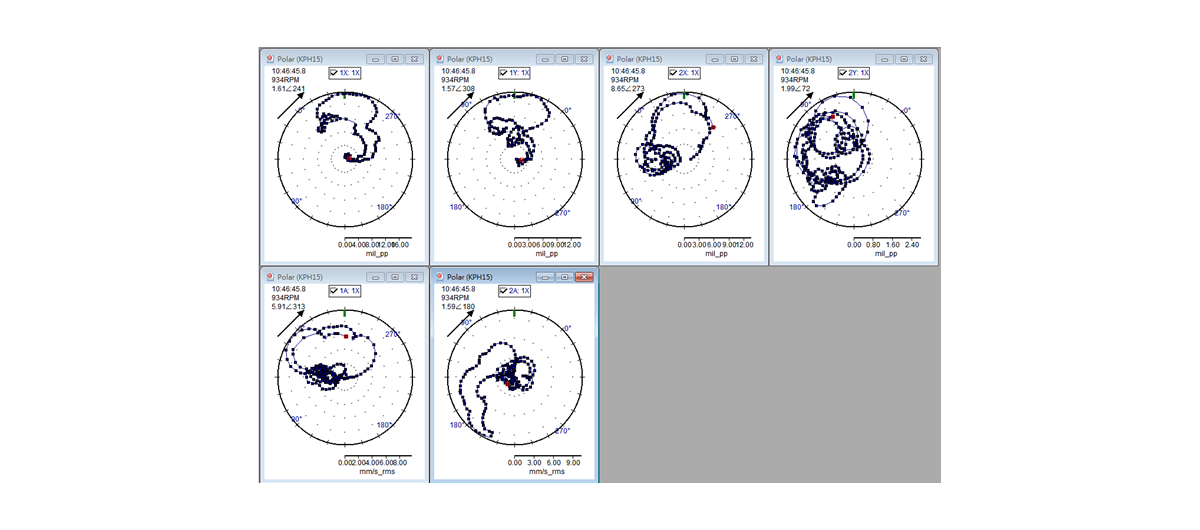
Bode plot, polar plot, orbit, filtered orbit and the shaft centerline, and more 

• Provides necessary information to engineers who conduct analysis on the machines
Supports 2 Tachometer Signal Inputs
Based on the two different tacho signals, TurboStar Turbomachinery Vibration Analyzer can conduct two parallel calculations of order tracking and generate two sets of measured data. This feature is especially useful when measuring two machines before and after their shafts are coupled. 
Field-Proven Accuracy
TurboStar's turbomachinery vibration analysis adopts the algorithm of “high-spot absolute phase” for measuring vibration phases, which are identical with the results of other main products in this market. Phase measurement accuracy is especially important for rotor balancing in the field. 


TurboStar Turbomachinery Vibration Analyzer

The TurboStar Turbomachinery Vibration Analyzer was designed with a deep understanding of your needs in turbomachinery vibration analysis and preditive maintenance.
• Available in 14-, 22-, or 30-channel systems, based on your measurement requirements
• Powerful software displays many important indicators, including Bode plot, polar plot, orbit, filtered orbit, shaft centerline, and more
• Providing necessary information to engineers who conduct analysis perform predictive maintenance on turbomachinery
• Simple yet powerful user interface makes complicated measurement setups easy and fast

TurboStar turbomachinery channel 24 vibration analyzer, orbit, filtered orbit, polar plot, bode plot, shaft centerline    TurboStar turbomachinery 16 channel vibration analyzer, orbit, filtered orbit, polar plot, bode plot, shaft centerline

TurboStar turbomachinery vibration analyzer setup display for turbomachinery vibration analysis and predictive maintenance


Powered by SQL Database

TurboStar Turbomachinery Vibration Analyzer uses SQL (Structured Query Language) database for storing measured data. Each data point is automatically saved to the database once measured. This prevents any loss of data due to accidental system shut down. TurboStar's SQL database supports long monitoring intervals and large data sizes without slowing down the system performance.
 

Up to 2 Tacho Signal Inputs

TurboStar Turbomachinery Vibration Analyzer allows you to connect  two independent tachometer signals at the same time. Based on the two different tacho signals, TurboStar can conduct two parallel calculations of order tracking and generate two sets of measured data, at the same time. This feature is especially useful when you need to measure two machines before and after their shafts are coupled.
 

IEPE Power and Protection

TurboStar Turbomachinery Vibration Analyzer provides IEPE power directly to your sensors from each input channel. IEPE power is enabled from both the software and the IEPE power switch on the instrument. This feature provides additional protection and prevents the risk of tripping your protection system by accident.
 

Accurate Measured Data

TurboStar Turbomachinery Vibration Analyzer is a field-proven system providing accurately measured data. It adopts the algorithm of “high-spot absolute phase” for turbomachinery vibration analysis, which are identical with the results of other main products in this market. The accuracy of phase measurement is critical for engineers who conduct rotor balancing in the field.

Polar plot of turbomachinery vibration analysis   Bode plot and tabular plot of turbomachinery vibration analysis

TurboStar Turbomachinery Vibration Analyzer filtered orbit and unfiltered orbit plot TurboStar Turbomachinery Vibration Analyzer waterfall plot


TurboStar Turbomachinery Vibration Analyzer Specifications

Data Acquisition Hardware

• Analog input channels: 14, 22, or 30 channels
• Tachometer input channels:2 channels
• Sensor types: displacement, velocity and acceleration sensors
• Input range:±20V
• Input impedance:1 MΩ (for all analog and tacho input channels)
• Max frequency band: 40 kHz (102.4kHz sampling rate)
• Range of tacho input: 12~120k RPM
• Coupling of input channels: AC, DC, IEPE
• IEPE power: hard switch on the back panel
• Resolution of A/D converters: 24bit
• Types of tacho signals
   - Proximity Probes
   - Optical Sensors
   - TTL
   - Displacement Sensor
   - Other AC-type signals


Predictive Maintenance Software

• Input channel setup: channel label, angle, sensor type, sensitivity, direction of rotation.
• Tacho channel setup: orientation, Hysteresis, trigger method, trigger slope, range of speed, max number of records, etc.
• Triggering slope: positive, negative, both
• Measurement control panel (accessible during measurement):  start, stop, change RPM interval, change time interval
• Tacho signal: can observe waveform of tacho during measurement
• Measurement control
   - Control methodDelta RPM (up or down), Delta Time
   - Delta RPMUp/Down, interval  (5, 10, 20, 30, 40, 50, 75, 100 RPM or user defined)
   - Delta Time
set in minutes, secondes, or 1/10 sec
• Start data recording as one of the following conditions happens
   - Date and time: defined date and time is due
   - Speed: Rotation speed enters the specified range
   - Amplitude: an amplitude (nX or directs) enters the specified range
   - Phase: a phase value enters the specified range
• Measured functions: time waveform, spectrum, orbit, trend, Bode, polar, waterfall (map), tabular data
• Order resolutions1/4, 1/8, 1/16. 1/32
• Maximum order5, 10, 20, 50, 100,200
• Average types: linear, exponential, peak-hold
• Overlap0%, 25%, 50%, 75%, Max
• Spectrum setup:
   - Frequency band50, 100, 200, 500 Hz
   - Resolutions100, 200, 400, 800 lines
   - WindowsHanning, Flattop, rectangular